
From the intricate task of dissecting massive datasets to tackling the risks that come with AI transformation, the field of data science is not one for the faint-hearted. James Poulten, Lead Data Scientist at Made Tech, discusses key lessons from his recent projects and the thrill (according to him) of transforming raw data into valuable data-driven insights.
Q: What does a data scientist do?
My data journey started in academia. I don’t think I would have stuck at physics as long as I did if I didn’t enjoy analysing data and answering questions. Even with a PhD, I struggled to break into the industry. I started as a junior developer and involved myself with as much data work as I could.
As a data scientist at Made Tech, my main task is to analyse large datasets and provide actionable insights for clients. Often, I start projects without much context or background knowledge, receiving raw data and being asked to extract value from it. It’s about not being intimidated by vast amounts of data and asking the right questions to understand the problem at hand.
Q: What skills do you need in data science?
Data science is primarily about your ability to craft and present a story using data. Communicating technical information to non-technical stakeholders and presenting, are your bread and butter. Secondary to this, it’s helpful to have a strong foundation in programming Python or R, as well as proficiency in statistical analysis and machine learning algorithms.
Q: What are some of the challenges when it comes to working on data projects?
How to get hold of the right data
Organisations usually provide what they believe to be the right data, but I’ll often need to ask additional questions to gather further context and make sure that the data they’ve given me is actually related to the problem at hand.
Clients aren’t trying to hide anything; they genuinely want some help to understand and make better use of their data. However, they may not always provide all the right information upfront. Knowledge that is second nature to them often isn’t obvious to an outsider looking in.
Addressing poor data governance
My nemesis is Excel because it gives everybody just enough power to cause a lot of trouble! Versioning issues and poor data governance can seriously affect data management projects. A beautifully formatted Excel spreadsheet with animations and gradients looks fantastic, but actually doing something meaningful with it can be hard. First I have to strip away the bells and whistles just to get to the raw data, and this is all before I discover that everyone has their own version of “real_final_final_report_v3.xls”.
Handling bad historical data quality
If you go back a few years, data quality was considerably worse than it is now. So for example, if I’m developing predictive models, then I need to look back in order to look forward and the further back I go, the worse the data quality. The penny has started to drop. Organisations are now realising that the quality of their data will affect their future ability to deploy AI and Machine Learning (ML) tools. As a result, I’ve seen data quality really starting to improve.
Q: What’s the first step on a data project?
The first question I always ask is about a client’s data maturity. It’s important to understand their current level of data management. If they’re unsure what ‘data maturity’ actually means, a simpler question like, “Where do you store your data?” can help to shed light on the situation.
Clients often boast about using data-driven insight. But in reality, it’s usually just one person trying to interpret a graph. These individuals often lack the training of an analyst or data scientist and they may feel overwhelmed by the data they’ve inherited.
Q: Can you give me an example of a data project you’ve worked on and the benefits it’s delivered?
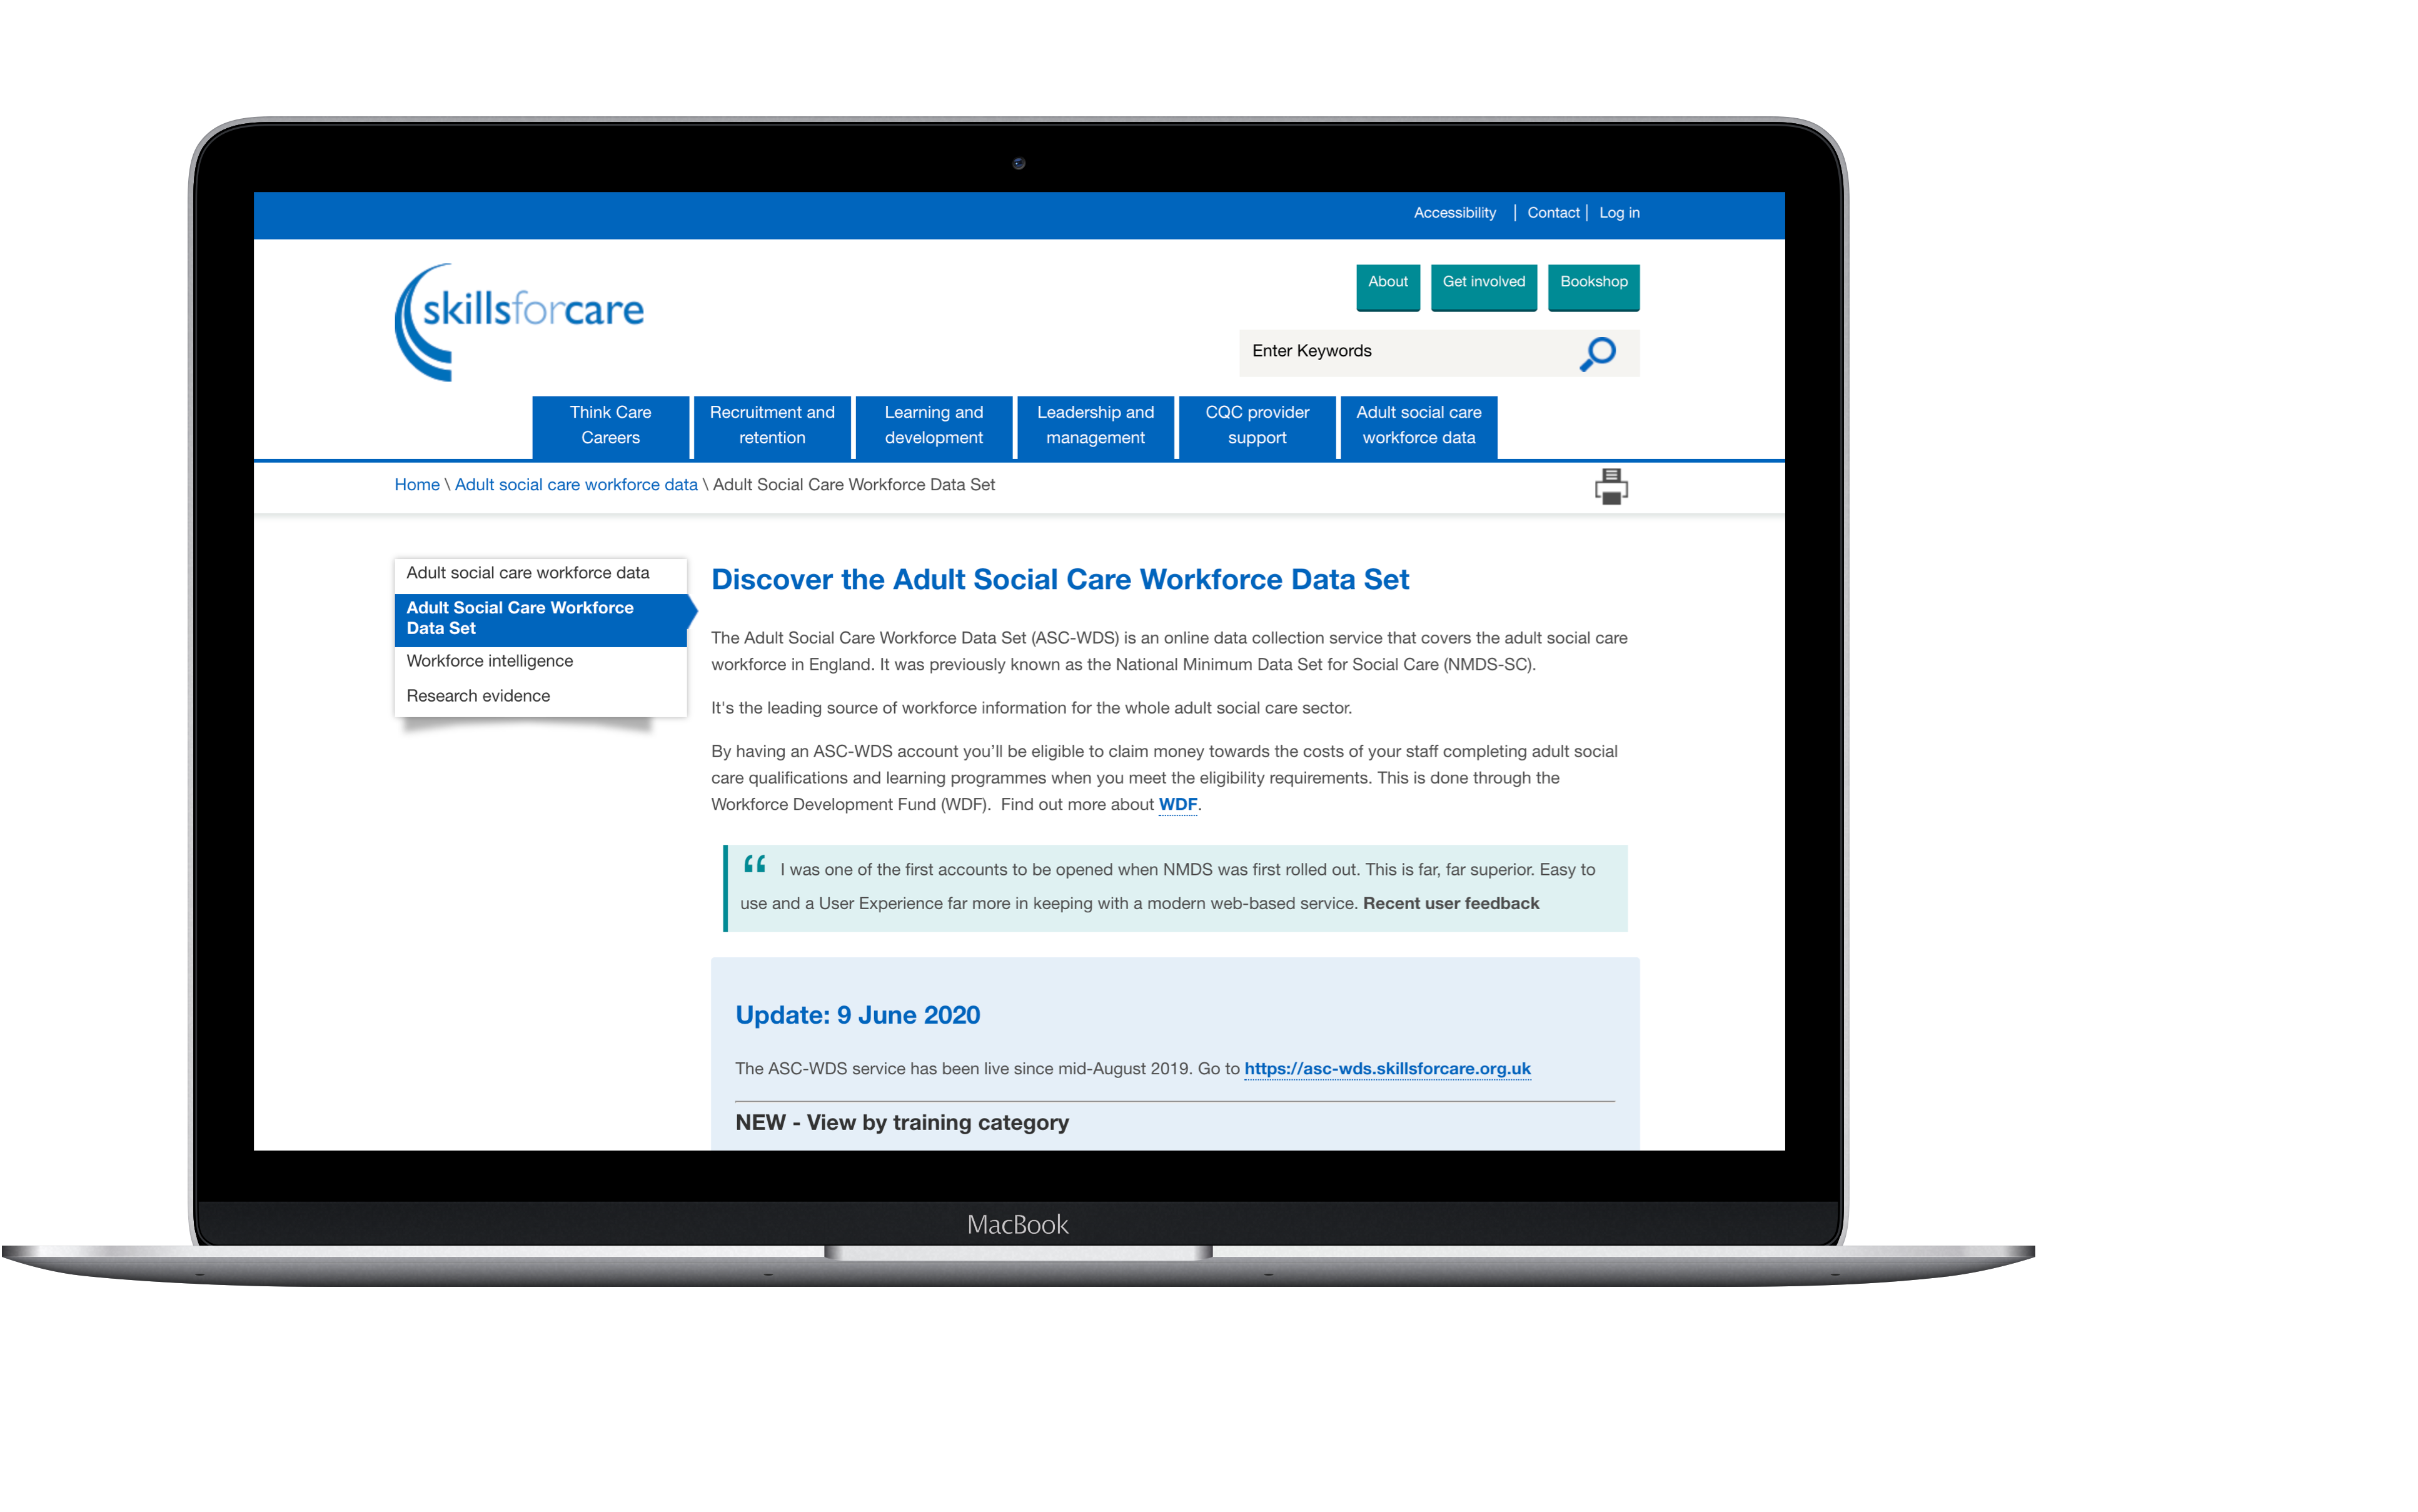
An example that springs to mind is a piece of data modelling work we did recently with Skills for Care, a strategic planning body that monitors the adult social care industry.
Care providers aren’t currently required by the government to report the number of carers they employ or how many work at a specific facility. This means that at the moment, the government has limited visibility of the true scale of the care sector.
While Skills for Care were using machine learning to estimate the size of the sector, they still lacked the time and experience to really harness the full potential of the data they have. After joining the project, I quickly worked through some initial exploratory analysis, before building a predictive data model that incorporated characteristics such as geographical location and other features of care homes. The improved model can now far more accurately predict the number of carers at a specific facility, providing valuable insights for the government on the size of the adult social care sector, which includes tens of thousands of care homes.
Some care homes already report their numbers reliably, but our model has significantly improved the Skills for Care data quality. Now they know which questions to ask and have automated processes to make it easier to upload data.
Improved data accuracy
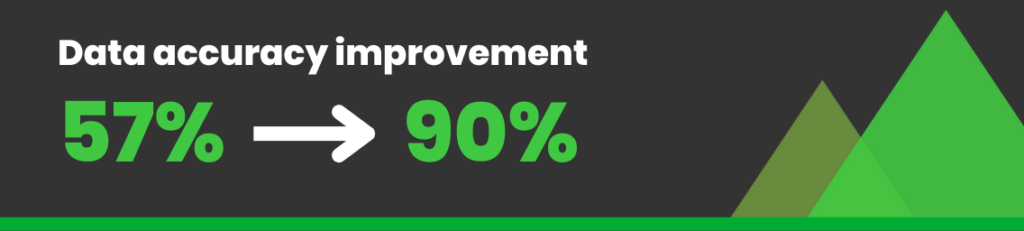
Skills for Care initially used just two features to create a simple statistical (regression) model with their data, which took their analytics team about six months to prepare and run, achieving an accuracy (R-squared value) of around 56%. By the time we completed our project in March, we had revolutionised their data process. What used to take six months is now a 20-minute automated job that runs every two weeks. We expanded their model from using two features to 58, boosting the accuracy to an R-squared value of 86-90%.
For me, the most rewarding part is enhancing the quality of data and reporting. This data is now included in reports provided to the Cabinet Office and while we can’t control government decisions, we can make sure that they have access to accurate data for informed decision-making.
Q: Can you tell me more about the intersection between Data Science and AI?
To be clear, AI is a branch of data science. In recent years, the hype has focused on Generative or Gen AI and Large Language Models (LLMs). But the reality is that these tools aren’t as new as they seem. Data scientists have been using similar techniques for years. The promotion is being driven by marketing and venture capital interests. Companies use AI as a buzzword to attract investors and boost their share prices. In my experience, there is a limit to how much impact a fancy chatbot can have.
The risks of AI
Without the human-in-the-loop, AI models can mislead and cause significant legal and ethical issues. Hallucinations, where AI generates false information, are already causing havoc. Another area where organisations regularly trip up is around compliance. If you’re using AI models such as ChatGPT and anthropic Claude Three, your data will be loaded to servers in the US. This raises privacy concerns, and falls foul of regulations like GDPR. Instead, the true potential of AI and the art of data science lies in augmenting human processes, offering a greater level of insight to leaders and decision makers and providing real time analysis that allows them to make better decisions.
What is responsible AI?
Understanding how your AI model interacts with your data to produce results is crucial. The explainability of your AI needs to be a top priority. At the end of the day, whichever mathematical model you’re working with, be it a regression, classification, or a clustering model, it’s ultimately the maths behind it that drives the outcomes.
For instance, if your model categorises a person as ‘A’ or predicts a spending amount of ‘B’, it’s essential to be able to explain why these decisions were made. Someone might ask for clarity on these points, and being able to break down the model’s process is a key aspect of data science. This transparency is what we mean by responsible AI and explainability.
Q: What can organisations do to protect themselves when using GenAI?
A couple of years ago, my answer would have been to avoid using them altogether – there are too many security and liability issues. There’s also an entire data science sub-discipline – Natural Language Processing (NLP)- that would deliver 90% of the value with none of the risk or cost (but these services are expensive to integrate). That said, GenAI has continued to develop and, these days, organisations can reduce the risks considerably. These are some of the options:
Deploy local instances of GenAI models
You can run LLMs on your local device now, so all your data stays on your machine.
Use cloud services like Azure OpenAI
These give you better control, allow you to understand how your data is being used and give you the option to build customised instances. For example, Zurich Insurance Group, are now using a customised version of ChatGPT to simplify lengthy claims documents.
Explore smaller open-source models
These models, although far less expensive, still offer a similar level of performance compared to the expensive closed-source alternatives. They also provide transparency and customisation options.
Understanding the maths behind the data
The world of data science and AI has been an exciting journey for me. Whether it’s improving the quality of data for better decision-making, or making sure that AI models are transparent, the principles remain the same. It’s about breaking down the data, understanding the mathematical relations behind it, and turning raw information into insights that make a real difference.
And at the end of the day, never forget that it’s all just maths. Whether you’re working on a simple regression model or deploying advanced Generative AIs, understanding the underlying mathematics will always point to the right solution.
If you’d like to find out more about jobs at Made Tech browse our careers or take a look at some of the data consultancy and AI services we provide to clients.
Laying the groundwork for AI
Unlock your AI potential: Discover your archetype, master the 3 pillars of data maturity, and learn from real-world transformations in our latest whitepaper, Laying the Groundwork for AI.
About the Author
James Poulten
Lead Data Scientist at Made Tech
James Poulten has a PhD in Experimental Quantum Matter Physics and has spent 6 years consulting public sector organisations. Currently a Lead Data Scientist at Made Tech, James has worked with a range of big-name public sector organisations including the likes of Border Force, the Cabinet Office and Number 10 Data Science. He's also lent his expertise to the Department for Levelling up, Housing and Community, Skills for Care and the Met Office.